Tree inventory as a living map, how arborists use OrbGIS
Every tree becomes a point on the map with its own history, you record in the field from a phone, and the client follows the stand through a link. Here is how it works step by step, and how little it costs.
You do tree inventories, inspections and tree management plans. In two or three years the same stand has to be surveyed again, and most people start from zero: a new spreadsheet, a new report, new photos. The old material sits in a PDF at the client's and in a folder on someone's laptop, and it rarely gets built on.
OrbGIS is a map that lives on between visits. Every tree stays as a point with its history: what you assessed last time, which action was proposed and when. Next time you add to it instead of redoing it, and the client can see for themselves how the stand has developed over the years. This article walks through what that looks like in practice, what it costs and what you need to know. The answer to the last one is: nothing in particular. You do not need to know GIS. The word in this text is map.
The short version#
- One tree, one point, the whole history. Click a tree and you see every visit: condition, risk class, proposed action, date and who assessed it.
- Record in the field from a phone. A form you build yourself, with your own fields, filled in on the phone and on the map the moment you tap send.
- The client gets a link. The map is always the latest version. No attachment to hunt for in an inbox, no login, no account.
- You only pay for the people who record. Everyone who only looks is free, however many they are. One arborist in the field costs 750 kr a month, all included.
What it looks like in OrbGIS#
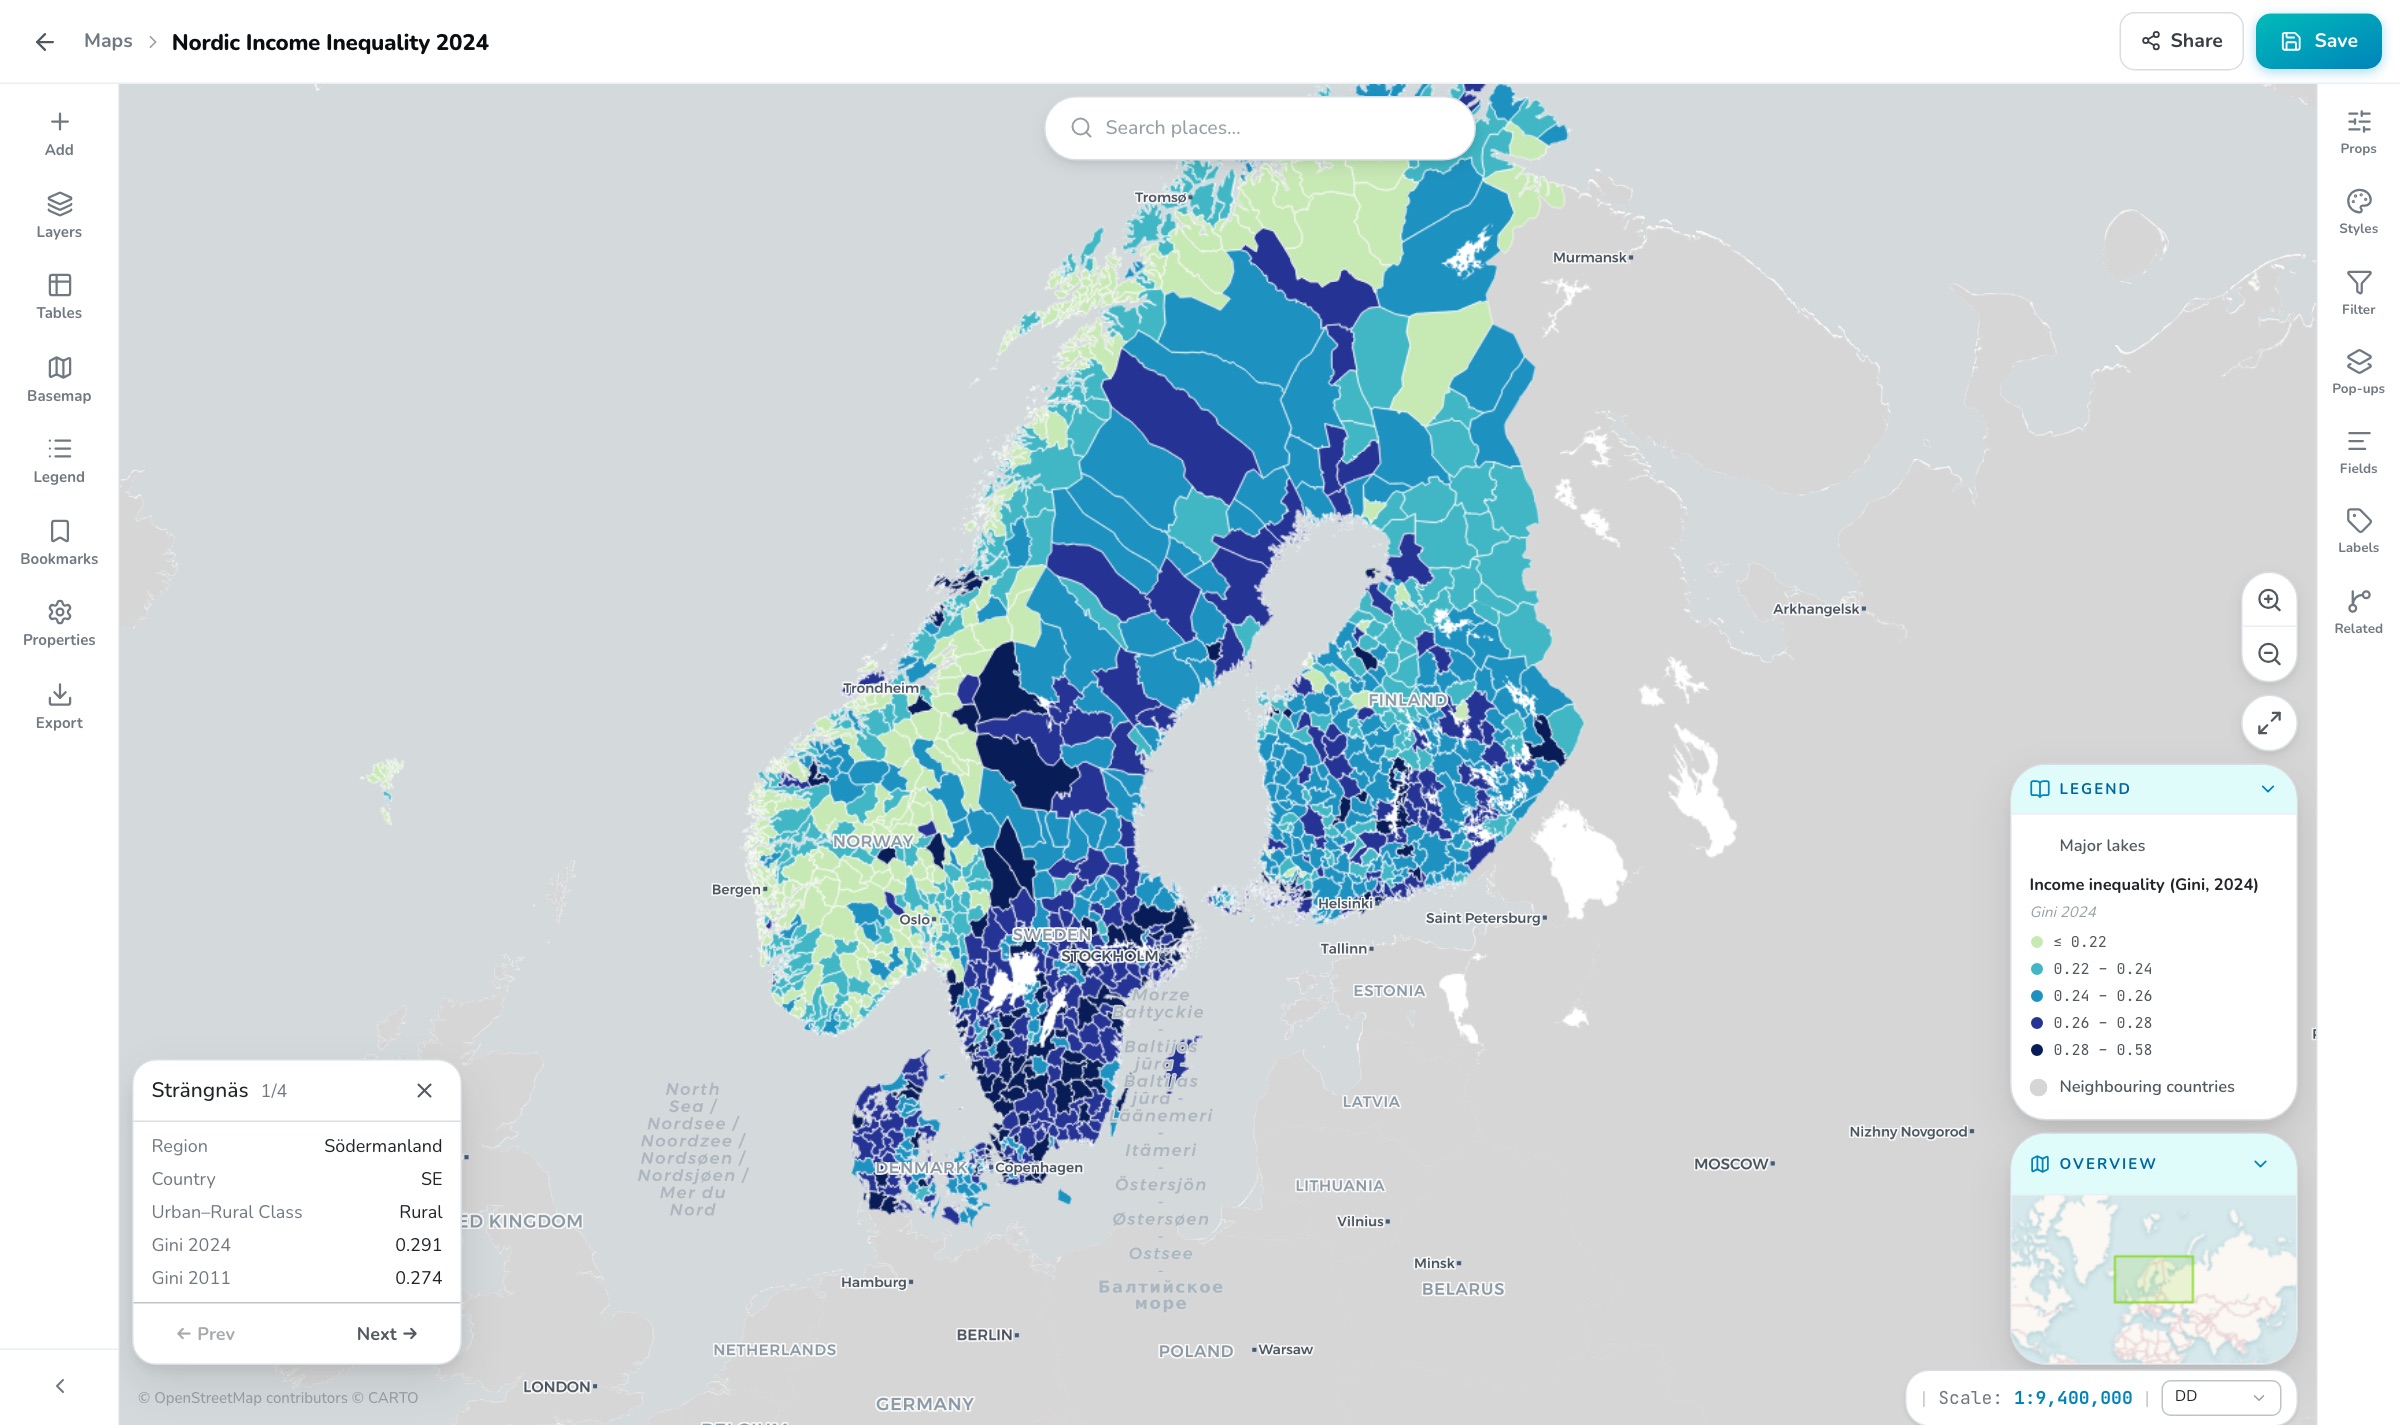
Think of the stand as a map where every tree is a point. The point has a tree number, the same as on the tag in the tree, and a few facts that rarely change: species, planting year, girth, location.
Each tree then has a list of visits. A visit is one row with a date, condition, risk class, proposed action, an optional comment and who made the assessment. The first time you inventory, every tree has one visit. On the next round it has two, and so on. Click a tree on the map and its facts appear at the top, with the visits listed below, newest first.
That is the whole model. Everything else in this article, the field form, the client's link, the report, is built on those two things: trees and visits.
Step by step: from spreadsheet to living map#
1. Load the stand#
If you have the stand in a spreadsheet with coordinates, upload the sheet as it is and every row becomes a point on the map. OrbGIS reads SWEREF 99 TM and the other Nordic and European coordinate systems automatically. If the stand comes as a file from a previous supplier, for example a shapefile or a GeoPackage, upload it directly.
If there is no material at all, start in the field instead: every tree you record with the form in the next step becomes a new point on the map. Nothing needs preparing first.
2. Record in the field from a phone#
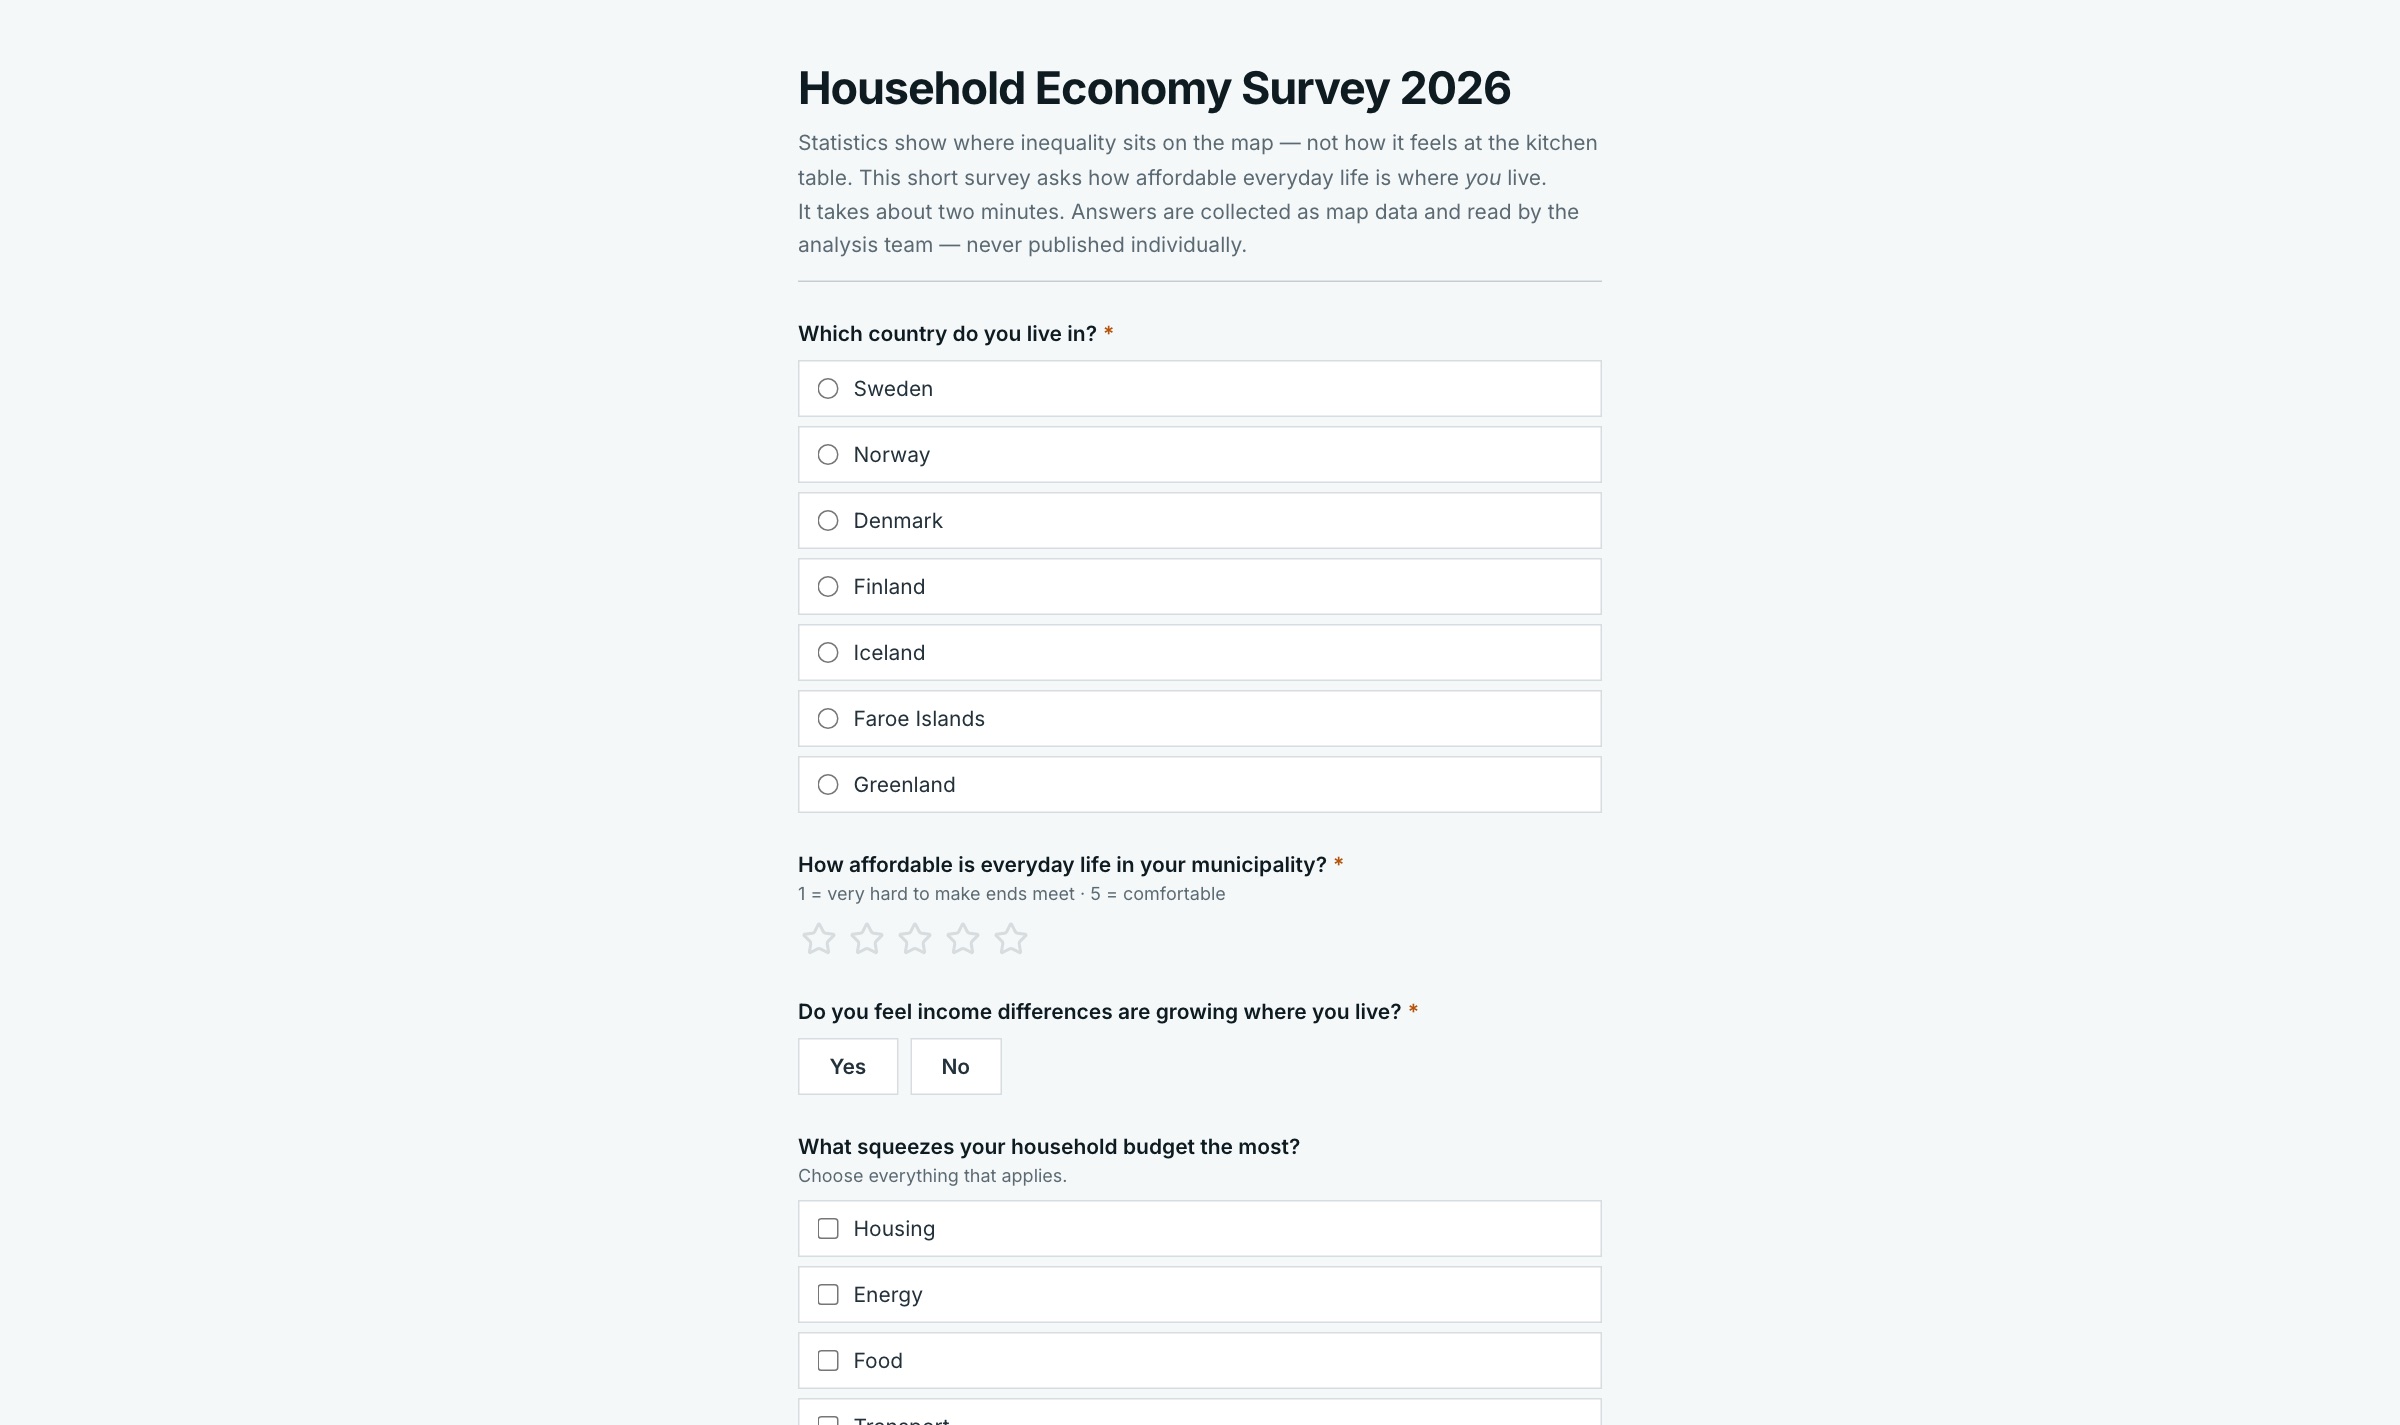
You build a form with exactly the fields you normally fill in: tree number, species, condition, risk class, proposed action, a free-text comment. Questions can be text, numbers, a choice from a list, yes or no, a date or a star rating, and a question can stay hidden until another has been answered a certain way, so the action fields only appear once you have marked that an action is needed.
In the field you open the form on the phone. Set the location with one tap on "use my location" or by pointing on the map, and when you send, the tree is on the map before the phone is back in your pocket. The form does not require a login unless you want one, a link is enough. That means a seasonal worker or a subcontractor can record without an account of their own.
3. The history builds itself#
Every visit you record lands in a table, and the table is linked to the tree through the tree number. That link is what makes every visit show up when you click the tree, and what saves you from digging through old reports to see what was said last time.
On the next round you stand at the same tree, fill in the same form and send. The tree gets one more visit in its list. You add to it instead of starting over.
4. The client gets a link#
You put together a simple page with the map, a counter showing the number of trees per risk class and a couple of filters, for example year and action. The page is published on your own address, you get a link and a QR code, and you send the link to the client.
The client clicks the link and sees the map. No login, no account, nothing to install. Click a tree and they see the history. Pick "action proposed" in the filter and they see which trees it concerns. And because the page shows what is on the map right now, it is always the latest version. If you recorded ten trees in the morning, they are there when the client looks in the afternoon.
If you would rather hand over something closer to a report, build a narrative page instead: an introduction, the map, a few key figures, pictures and your assessment in prose. It is published the same way, as a link.
5. The report and the paper copy#
Many clients still want something to print. OrbGIS produces print-quality map sheets at exact scale, with legend, scale bar and north arrow, as PDF. If you need the table in Excel, export it whenever you like, free. If something needs correcting afterwards, open the stand as a spreadsheet in the browser, change it and save, and the map updates.
Photos#
Photos are part of every inspection, and here we want to be clear about what applies today. Pictures are uploaded to OrbGIS as files and live in the same project as the map, so they are kept in one place instead of on a phone or in an email thread. To show pictures to the client you place them in the narrative page, ideally with a caption stating tree number and date. Taking a photo directly in a form field, so the picture attaches to the tree automatically, is not something we offer yet. If that matters to you we would like to hear it, it shapes what we build next.
The next round, and the one after that#
This is where the difference shows. When the same stand is due again in three years you open the same map. Every tree is still there with its visits. On site you see what you assessed last time and whether the action was carried out, and you record the new visit in the same form.
The client, in turn, can compare across years. How many trees were in the highest risk class in 2026 and how many are in 2029? Which proposed actions were never carried out? With a year filter on the map those are questions answered with one click instead of two reports side by side. For a cemetery administration or a municipality managing stands over decades, that is often what decides it.
And it is your data. If you ever change tools, you export everything in open formats, free, and take it with you.
What it costs#
The pricing model is simple: you pay for the people who record and edit, and for storage space. Everyone who only looks is free, whether that is the client, a colleague or an administration with twenty officers.
| Per year | Per month | |
|---|---|---|
| One person who records | 8 000 kr | 667 kr |
| Storage, 5 GB (enough for very large stands) | 1 000 kr | 83 kr |
| One arborist in the field, total | 9 000 kr | 750 kr |
| Clients, colleagues and everyone else who looks | 0 kr | 0 kr |
Three arborists in the field with the same storage come to 25 000 kr a year. There are no other fees, no credits to top up and no lock-in, the subscription runs month by month and can be cancelled whenever you like. The pricing calculator on the start page works out the sum for your numbers.
You start with a free 14-day trial, with every feature and without entering a card.
Common questions#
Do I need to know GIS? No. You build the form by adding questions, upload the spreadsheet by dragging it in, and the map does the rest. We are happy to set up the first stand together with you.
Does it work on a phone? Yes. The form is filled in in the phone's browser, and the map works on phone, tablet and laptop. There is no app to install. The form needs a connection when you send, so in areas with no coverage at all you send once coverage is back.
Can the client change the map? No. Whoever looks through the link sees the map and the history but cannot change anything. If the client's own staff should record visits, give them a form, or add them as editors.
We already have old inventories in Excel. Can they come along? Yes. Upload the sheet and the rows become points on the map, provided there are coordinates. Without coordinates you can place the trees in the field at the next visit and load the old assessments as a first visit.
We already use QGIS. Then keep using it. OrbGIS has a free QGIS plugin that opens the same map there, so you can edit the trees with QGIS tools and save back. The client notices no difference.
Where is the data stored? Within the EU, with European providers, and Swedish hosting can be written into the contract. The data is yours, and you can export everything at any time.
See it with your own stand#
The easiest way to understand how it feels is to see one of your own stands on the map. If you have 20 minutes we load it together, so you see what the form, the map and the client's link look like with your trees. Book a time or write to info@orbgis.se.
If you would rather try it yourself, create an account at app.orbgis.se and upload a spreadsheet. The trial is free for 14 days.
Get new articles by email
One email when we publish something new, nothing else.