Create your first dashboard
Turn a web map into a live operational view: indicators, charts and tables around the map, all bound to the same layers, click a chart and the map filters.
You’ll want a saved web map first, see Create your first map. Building dashboards requires the Editor role or higher; publishing one publicly requires Publisher or Admin.
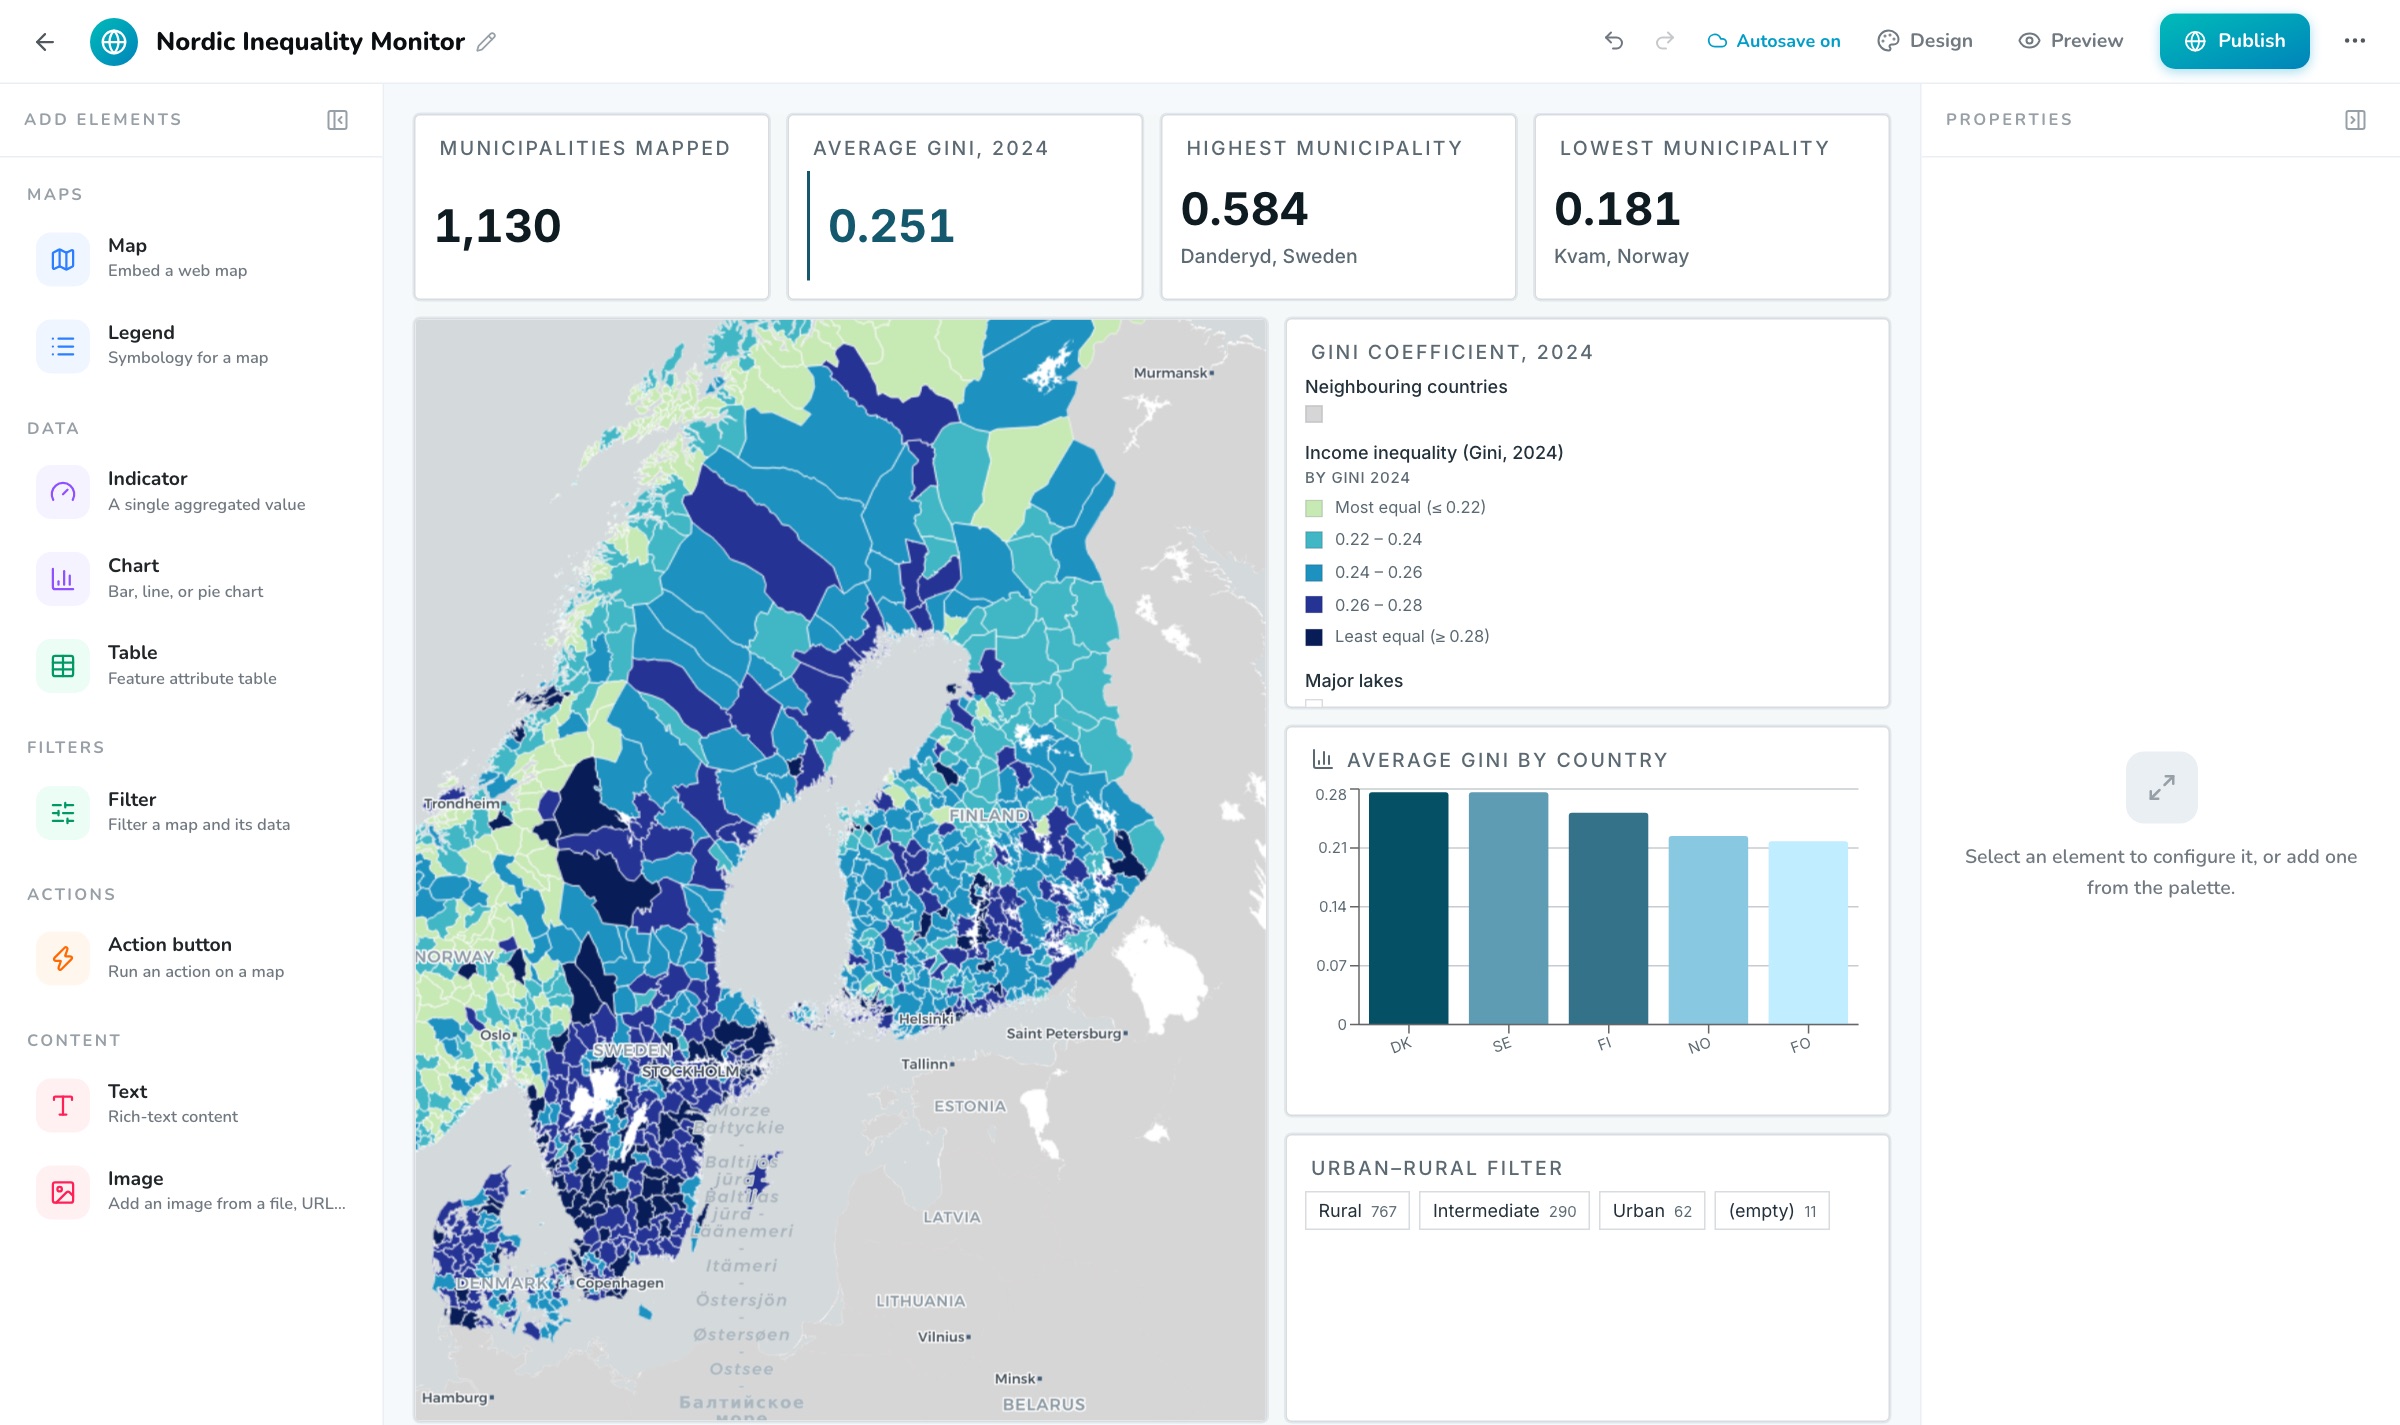
Create the dashboard
Open Apps → Dashboards and press Create dashboard. Start blank, from the built-in Overview dashboard template, or from a template your organization has saved.
Add a Map element
Drag Map from the Add elements palette onto the canvas and pick your web map. The dashboard’s data elements will bind to the layers inside this map, no separate data setup.
Add an Indicator
Drag in an Indicator, then in the Properties panel bind it: choose the map element, one of its layers, a field and an aggregation (Count, Sum, Average, Minimum or Maximum). Format it with prefix, suffix and decimals.
Add a Chart
Add a Chart (bar, line or pie), pick the category field and the value. Turn on its click-to-filter option so clicking a bar or slice filters the other elements by that category.
Add a Filter
Add a Filter element for your readers: category values as pills or a searchable dropdown, a numeric range slider, or a date picker. Per element you choose whether it filters everything or just the map.
Arrange and design
Everything sits on a 12-column grid, drag to move, pull any edge to resize. Open Design to apply one of your organization’s themes; colors, fonts, radius and spacing switch together. Edits autosave as you go.
Preview and publish
Use Preview to see the dashboard as readers will. When it’s ready, press Publish, the sidesheet lists exactly which datasets become publicly readable, then gives you the public link (
your-org.orbgis.se/your-dashboard) and a QR code. Publishing requires the Publisher or Admin role.
How the crossfiltering behaves#
Filters, chart clicks and table-row clicks all publish to a shared runtime. The map applies filters client-side on the vector tiles it already has, nothing re-downloads, features simply drop out. Charts, tables and indicators re-query with the combined filter. A chart deliberately ignores its own filter, so clicking a bar never collapses the chart to a single bar. You can also let the map zoom to the filtered selection.
The full element reference, all nine element types, seven action-button actions and three filter modes, is in Dashboards.